
That was quite a week. These days a Federal Reserve (Fed) policy meeting alone gets a lot of headlines and has market participants on the edge of their seats. Add to that the second straight quarter of negative gross domestic product (GDP) growth that exacerbated recession fears, the busiest week of earnings season, and important but sometimes under-the-radar inflation data, and last week was epic for market watchers. Here’s the good news: Markets liked it.
Fed Meeting Recap: Market Gets a Whiff of a Pivot
Let’s start our recap of the epic week with the Fed meeting. Perhaps the market’s biggest fear has been that the Fed may overdo its tightening to fight inflation and send the economy into a painful recession, break something, or both. Last week’s Federal Open Market Committee (FOMC) meeting, while broadly in line with expectations, did give the market a bit more confidence that nothing would break, while also seemingly maintaining its inflation-fighting credibility.
As expected, the Committee raised short-term interest rates by 75 basis points (0.75%) to take the fed funds rate to 2.5% (upper bound). By the Fed’s estimate, 2.5% is the long run neutral rate—the level where monetary policy is neither contractionary nor expansionary. As inflationary pressures continue to run much higher than the Fed’s 2% target, the fed funds rate needs to get above the neutral level to help balance aggregate supply and demand.
During the press conference, which took place immediately after the conclusion of the FOMC meeting, however, Chairman Jerome Powell seemingly indicated a willingness to slow the pace of rate hikes. He acknowledged that the economy is slowing (which is what the Fed wants) and that the full effect of the rate hikes had not yet been felt. He said the Committee would react to growth, labor market, and inflation data, versus only focusing on inflation data. He also described 75 basis point hikes as “unusually large”, which helped take market expectations for future rate hikes down.
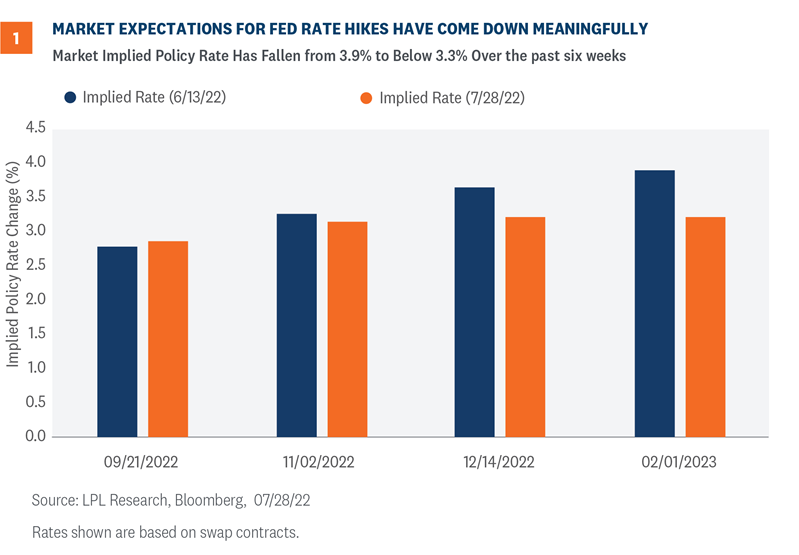
The market now expects a peak fed funds rate around 3.3%, down from a nearly 4% rate that was priced in last month [Figure 1]. We continue to think the Fed will likely increase rates this year up to approximately 3.5% if the labor market remains stable. However, the central bank could begin cutting again in the back half of 2023 if the economy shows significant weakness. There is precedent for election pauses, so it’s no slam dunk we’ll get a rate hike at the November 1-2 meeting FOMC meeting.
GDP Report Was a Mixed Bag
A day after the Fed hiked rates by 0.75% to an upper bound of 2.50% the markets had to digest a second consecutive quarter of negative growth. That naturally led more to ask the question: Are we in recession?
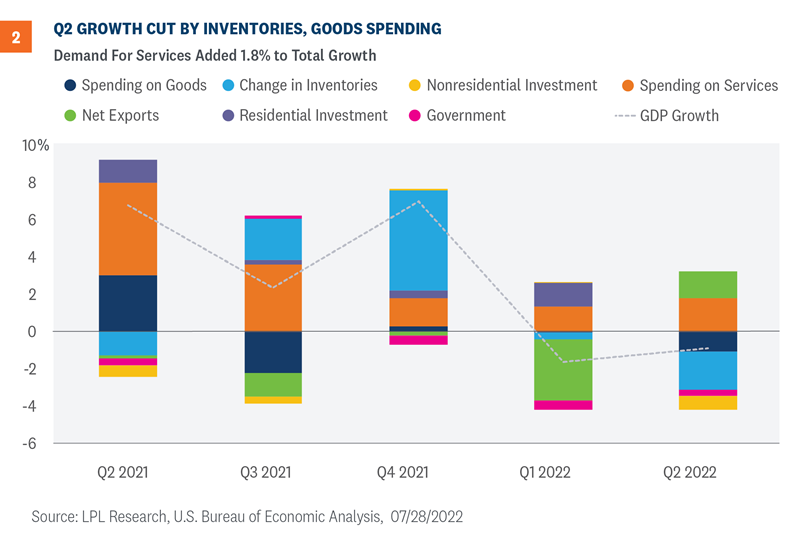
We do not believe the U.S. economy is in recession…at least not yet. Consumer spending has been too strong, as illustrated by the “spending on services” section in Figure 2. But the risks are undoubtedly rising for next year.
The technical definition of recession is not two consecutive quarters of negative growth as many believe, but rather must include these three ingredients:
- A significant decline
- A broad-based decline
- A persistent decline, i.e., typically lasting longer than a few months
Importantly, recessions do not always correlate with headline GDP data. While a recession in the next 12 months seems increasingly likely at this point, and two quarters of negative GDP growth usually ends up being classified as a recession, this may be another case where GDP data and recession dating do not align. The official arbiter of business cycle dating is the National Bureau of Economic Research (NBER). The economy is still feeling the ripple effects from the government-induced shutdowns. Of course, the U.S. had never before experienced the massive swings in economic activity during the 2020 pandemic, making even the current analysis more difficult.
That doesn’t take away from the fact that higher inflation is causing consumer spending to slow, while higher interest rates are weighing heavily on business investment. Declines in business capital spending reveal a budding weakness in the corporate sector of the economy and could potentially be a sign of more deterioration ahead. It also doesn’t take away from the fact that anemic growth means less profit opportunities for corporate America.
Turning back to the Fed, Jerome Powell and company will likely interpret this decline in real growth as confirmation to slow down the pace of rate hikes at upcoming meetings. Front-loading rate hikes will eventually mean smaller hikes—possibly as soon as the next FOMC meeting in September. The FOMC could still raise its target rate by another one percentage point by the end of the year, but that is predicated on a still-solid job market, which is no guarantee as corporate layoff announcements increase.
A Dizzying Flurry of Earnings
Results last week covering about one-third of all S&P 500 companies were well-received by the market. They weren’t all great, but with expectations so low, they were good enough to help push the market higher.
With analysts and strategists widely anticipating estimate cuts, the key to the market’s reaction to second quarter earnings is how well estimates hold up—and if those revised estimates are deemed credible.
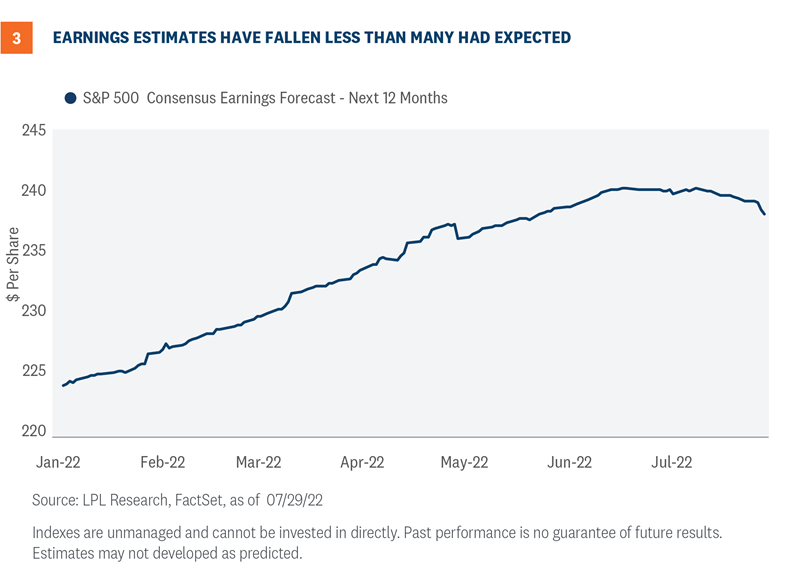
Sentiment from corporate leaders that have reported so far has been cautious, as is to be expected, which has led to a reduction in the 2022 consensus estimate for S&P earnings per share by about 0.8% [Figure 3] since June quarter-end companies began reporting in mid-July. We see slightly more downside to estimates as the rest of earnings results come in but expect our estimates will remain comfortably above consensus. As we noted in LPL Research’s Midyear Outlook 2022: Navigating Turbulence, we see corporate America potentially growing S&P 500 EPS by 8% in 2022 to $225 per share. That forecast is still about $3 below the consensus estimate.
The downside risk comes in 2023 where the consensus estimate has come down about $6 since mid-June to near $245. Our estimate is $235, implying further estimate cuts. However, in the event of a recession, something more like $200 to $210 is possible. It’s not our forecast, but it is within the range of possible outcomes.
Why do we think mid-single-digit earnings growth is still possible in 2023 with so much pessimism out there? First, we expect inflation to come down steadily through next year, facilitating the end of the Fed’s rate hike cycle and supporting profit margins. Second, inflation supports revenue through price increases (where there is pricing power), particularly within the natural resource sectors. Consider S&P 500 revenues are on track for a 13% year-over-year increase in the second quarter, about 3 percentage points above expectations entering the reporting period. And third, the economy was on relatively firm footing heading into this slowdown, with high consumer cash balances, low leverage, and strong corporate balance sheets. We may get an official recession later this year or next, but it should be mild if we do.
Conclusion
The risk-reward for stocks still looks favorable to us over the balance of the year based on what we see as more potential upside than downside despite lackluster economic growth in the first half. However, after a 12.6% bounce in the S&P 500 off the June 16 low, there is no doubt the risk-reward has gotten slightly less favorable. The S&P 500 forward price-to-earnings ratio (P/E) is back up to 17. The economic growth outlook has weakened. Earnings estimates have fallen. The latest round of inflation data shows little progress. And our technical analysis work suggests the path higher for the S&P 500 index is about to meet some stiff resistance.
But here’s the good news: Most of a mild recession was priced in at the June lows with a nearly 24% peak-to-trough decline in the broad market. Earnings estimates were expected to fall more than they have and now reflect more realistic expectations for the second half. Commodity prices and survey data have brought down inflation expectations which, importantly, gives the market some visibility into where the Fed’s rate hiking campaign may end.
Don’t forget that when the S&P 500 has dropped more than 20% over two quarters, as it did in the first half this year, it has gained back over 21% on average in the next half-year and over 31% on average a full year out. And the average one-year gain off of midterm election lows, which may have been set in June, has been over 30% historically.
Our year-end 2022 fair value S&P 500 target of 4,300-4,400 is just 4% above the July 29 closing price at the low end. We still expect a growing economy, steady, if not solid, earnings gains ahead, and stable interest rates to fuel higher stock prices, although further gains will be more difficult to achieve given the time it will take for inflation to come down enough for the Fed to more strongly signal a pause and higher valuations. We continue to recommend an overweight allocation to equities and underweight to fixed income relative to investors’ targets, as appropriate.
Click here to download a PDF of this report.
IMPORTANT DISCLOSURES
This material is for general information only and is not intended to provide specific advice or recommendations for any individual. There is no assurance that the views or strategies discussed are suitable for all investors or will yield positive outcomes. Investing involves risks including possible loss of principal. Any economic forecasts set forth may not develop as predicted and are subject to change.
References to markets, asset classes, and sectors are generally regarding the corresponding market index. Indexes are unmanaged statistical composites and cannot be invested into directly. Index performance is not indicative of the performance of any investment and does not reflect fees, expenses, or sales charges. All performance referenced is historical and is no guarantee of future results.
Any company names noted herein are for educational purposes only and not an indication of trading intent or a solicitation of their products or services. LPL Financial doesn’t provide research on individual equities.
All information is believed to be from reliable sources; however, LPL Financial makes no representation as to its completeness or accuracy.
U.S. Treasuries may be considered “safe haven” investments but do carry some degree of risk including interest rate, credit, and market risk. Bonds are subject to market and interest rate risk if sold prior to maturity. Bond values will decline as interest rates rise and bonds are subject to availability and change in price.
The Standard & Poor’s 500 Index (S&P500) is a capitalization-weighted index of 500 stocks designed to measure performance of the broad domestic economy through changes in the aggregate market value of 500 stocks representing all major industries.
The PE ratio (price-to-earnings ratio) is a measure of the price paid for a share relative to the annual net income or profit earned by the firm per share. It is a financial ratio used for valuation: a higher PE ratio means that investors are paying more for each unit of net income, so the stock is more expensive compared to one with lower PE ratio.
Earnings per share (EPS) is the portion of a company’s profit allocated to each outstanding share of common stock. EPS serves as an indicator of a company’s profitability. Earnings per share is generally considered to be the single most important variable in determining a share’s price. It is also a major component used to calculate the price-to-earnings valuation ratio.
All index data from FactSet.
This research material has been prepared by LPL Financial LLC.
Securities and advisory services offered through LPL Financial (LPL), a registered inv estment advisor and broker -dealer (member FINRA/SIPC). Insurance products are offered through LPL or its licensed affiliates. To the extent you are receiving investment a dvice from a separately registered independent investment advisor that is not an LPL affiliate, please note LPL makes no representation with respect to such entity.
| Not Insured by FDIC/NCUA or Any Other Government Agency | Not Bank/Credit Union Guaranteed | Not Bank/Credit Union Deposits or Obligations | May Lose Value |
RES-1227850-0722 | For Public Use | Tracking # 1-05310329 (Exp. 08/23)