

Investors cheered the two better-than-expected inflation reports last week, pushing the S&P 500 to 16% above its June 16 low and only 11% below its all-time high. After this rebound, the key question investors are asking is whether this is a bear market rally that will soon fizzle or the start of a new bull market. There’s too much uncertainty to have a high conviction view right now, but we do believe the odds have risen that a new bull market has begun.
Encouraging Signs
The news on the economy and corporate profits hasn’t been great lately, but thanks to low expectations, it’s been good enough to push stocks nicely higher. Sentiment had gotten so negative and major indexes so oversold that any developments on the good side of those low expectations had the ability to push stocks higher.
Now that better news is priced into stocks with the S&P 500 price-to-earnings ratio approaching 18, the next leg higher may be tough. That move will likely depend on the market gaining more confidence that the inflation battle will be won, setting the economy up for a soft landing as the Federal Reserve (Fed) slows its pace of rate hikes.
Technical Signals
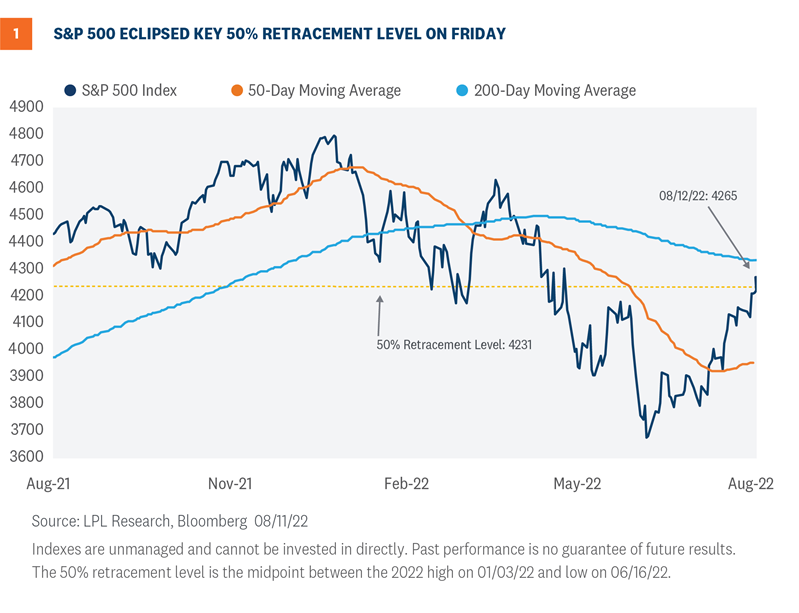
To better assess whether a new bull market has begun, we can look at some technical analysis signals that have historically been effective in identifying major market reversals. One is the 50% retracement level. The S&P 500 Index flirted with that level of 4,231 on August 11 but ultimately closed above it on Friday as shown in Figure 1. In all bear markets since WWII, when the index has risen above that retracement level, it has been the start the next bull market rather than a bear market rally which eventually fell to new lows (thanks to our friend Sam Stovall at CFRA for this great insight).
Surging Breath
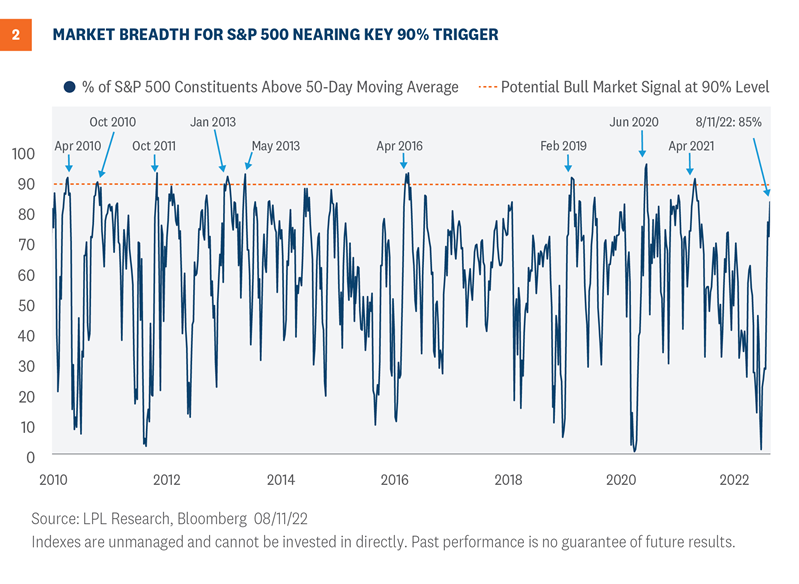
Another technical analysis signal that may end up accurately sounding the all-clear is the percentage of S&P 500 stocks trading above their 50-day moving averages. As shown in Figure 2, the 90% level has historically signaled the start of new bull markets coming off of major lows such as 2009, 2011, 2018-2019, and 2020. This indicator reached 87% on August 11, very close to that 90% trigger. While this is not a necessary condition for the end of the bear market, it would increase our confidence that a rally back to the old highs will come before a return to the June lows.
A Case That the Bottom Is In
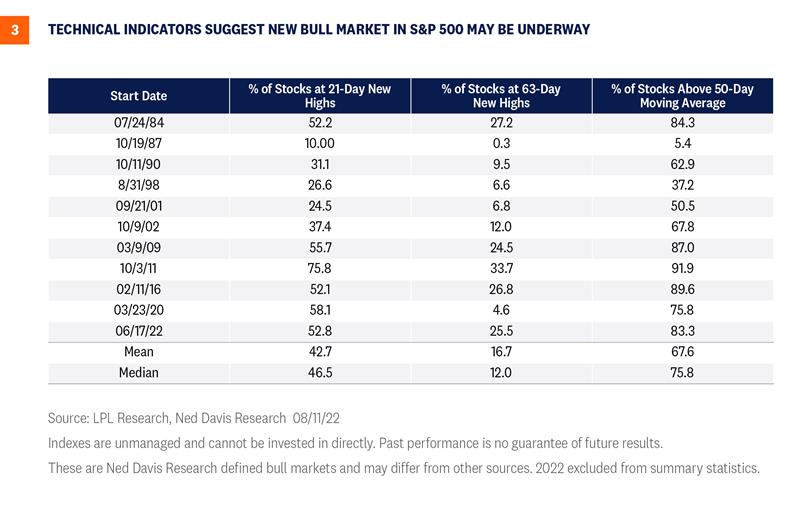
We can also look at some of these and other technical readings during historical early-stage bull markets. With the help of our friend Ed Clissold at Ned Davis Research, we have included three technical indicators, as well as the maximum levels they reached in the first 30 days of each of the past 11 bull markets, to compare them to today’s market.
As you can see in Figure 3, the percent of stocks at new 21-day highs near 53% is well above the average (43%) during these other young bulls.
Similarly, at over 25%, the percent of stocks at new 63-day highs is well above the 16.7% average for these other young bulls.
Finally, we go back to the percent of stocks above their 50-day moving averages. A very strong 83% of stocks in the Ned Davis Research multi-cap index are trading above their 50-day moving averages, well above the young bull market average of 67.6%. The statistic shown in Figure 2 is for the S&P 500, while this metric uses a broader market index used by Ned Davis and offers a very similar result.
In sum, the technical conditions of this market appear ripe for the start of a new bull market rather than a retest.
Will the S&P 500 Retest the Jne Lows?
Other than the question about recessions, we often get questions asking if the market will retest the June lows. Our answer to this question a month ago was probably yes, but now our answer is probably no. This is not just because of the positive technical analysis developments. It’s also about the news. The market became more comfortable with the inflation picture—seeing prices come down—and the likely path of the Fed. Meanwhile, earnings have been quite a bit better than many had feared.
However, there are some reasons to think a rollover and retest is possible:
- Bear market rallies: These are common and often large in size, although they are almost always below the 50% retracement level that the S&P 500 eclipsed last week. The 16% rally off the June 16 low is consistent with historical bear market rallies (the maximum bear market rally weighing in at 14.5% on average). The index rallied 11% in March 2022 before turning lower again.
- Lack of capitulation: Around the June lows, we did not quite see the levels of market capitulation or fear normally observed at historical major market lows that would indicate that all potential sellers have been flushed out. With some sellers still remaining, another wave of selling after this bounce is still possible, especially as the weak seasonal month of September is right around the corner.
- Fed policy mistake: A primary risk to markets at this point is the Fed overtightening, which pushes the U.S. economy into recession, causing unemployment to rise and slashing corporate profits. On the other hand, acting too slowly (or pivoting too quickly) could allow inflation to heat up even more and for inflation expectations to become untethered.
- Geopolitical risk: An escalating military conflict in Europe or Asia could potentially shock markets lower by driving commodity prices sharply higher, disrupting supply chains, and impairing consumer and business confidence (not to mention the horrible human cost of war). Though unlikely in our view, U.S.-China tensions or a broader European conflict certainly carry the potential to deliver a market shock that could push stocks back to their June lows.
Conclusion
Following the latest rally, the risk-reward for stocks has become more balanced. Still, with increasing odds that the June lows hold and our view that a soft landing may be as likely as recession, we remain comfortable with our recommended overweight to equities that we increased in early July. Stocks’ rebound past the 50% retracement level amid surging breadth are positive signals that a new bull market may be underway.
At the same time, the lack of capitulation, still-high risk of a Fed policy mistake, and tinder box of geopolitical tensions suggest perhaps this rally may be due for a pause or even a bit of a retreat. But that doesn’t change our belief that stocks have more room to run through year end and into 2023. We maintain our year-end 2022 fair value S&P 500 target range of 4,300-4,400 with upside above that range in a soft landing scenario.
Click here to download a PDF of this report.
IMPORTANT DISCLOSURES
This material is for general information only and is not intended to provide specific advice or recommendations for any individual. There is no assurance that the views or strategies discussed are suitable for all investors or will yield positive outcomes. Investing involves risks including possible loss of principal. Any economic forecasts set forth may not develop as predicted and are subject to change.
References to markets, asset classes, and sectors are generally regarding the corresponding market index. Indexes are unmanaged statistical composites and cannot be invested into directly. Index performance is not indicative of the performance of any investment and does not reflect fees, expenses, or sales charges. All performance referenced is historical and is no guarantee of future results.
Any company names noted herein are for educational purposes only and not an indication of trading intent or a solicitation of their products or services. LPL Financial doesn’t provide research on individual equities.
All information is believed to be from reliable sources; however, LPL Financial makes no representation as to its completeness or accuracy.
U.S. Treasuries may be considered “safe haven” investments but do carry some degree of risk including interest rate, credit, and market risk. Bonds are subject to market and interest rate risk if sold prior to maturity. Bond values will decline as interest rates rise and bonds are subject to availability and change in price.
The Standard & Poor’s 500 Index (S&P500) is a capitalization-weighted index of 500 stocks designed to measure performance of the broad domestic economy through changes in the aggregate market value of 500 stocks representing all major industries.
The PE ratio (price-to-earnings ratio) is a measure of the price paid for a share relative to the annual net income or profit earned by the firm per share. It is a financial ratio used for valuation: a higher PE ratio means that investors are paying more for each unit of net income, so the stock is more expensive compared to one with lower PE ratio.
Earnings per share (EPS) is the portion of a company’s profit allocated to each outstanding share of common stock. EPS serves as an indicator of a company’s profitability. Earnings per share is generally considered to be the single most important variable in determining a share’s price. It is also a major component used to calculate the price-to-earnings valuation ratio.
All index data from FactSet.
This research material has been prepared by LPL Financial LLC.
Securities and advisory services offered through LPL Financial (LPL), a registered inv estment advisor and broker -dealer (member FINRA/SIPC). Insurance products are offered through LPL or its licensed affiliates. To the extent you are receiving investment a dvice from a separately registered independent investment advisor that is not an LPL affiliate, please note LPL makes no representation with respect to such entity.
| Not Insured by FDIC/NCUA or Any Other Government Agency | Not Bank/Credit Union Guaranteed | Not Bank/Credit Union Deposits or Obligations | May Lose Value |
RES-1237802-0822 | For Public Use | Tracking # 1-05315581 (Exp. 08/23)