

We currently expect the U.S. economy to grow 3.7% in 2022. The risks are to the downside since the Fed may err on tightening too fast, the recent commodity spike may trickle down to the U.S. consumer, and supply and demand imbalances may last longer than expected. This forecast is lowered from our previous 4-4.5% range originally published in Outlook 2022: Passing the Baton. The rest of this commentary explains the overall themes supporting the forecast.
From One Risk to Another
The U.S. economy grew 5.7% in 2021, exhibiting strength after an unprecedented global pandemic, but as the economy marched into 2022, the COVID-19 Omicron variant squelched some of the rebound in economic activity. Most saw this headwind to be temporary and mostly affecting the first quarter estimates. The LPL growth forecast for 2022 was initially developed in November 2021, and so the reality of a new COVID-19 variant stage was yet to emerge. As the data came out, we saw the need to revise down our forecast for the year. We currently expect the U.S. economy to grow 3.7% in 2022 with risks to the downside for multiple reasons. The rest of this commentary explains the overall themes supporting the forecast. We end this note with risks and alternative scenarios.
From Shuttered to Unshuttered
Vaccination rates, COVID-19 cases, and hospitalizations have all improved in recent months and the data proves it. Google mobility trends for everything from theme parks to movie theaters are higher now than last year. Even though remote work seems to be available for many white-collar jobs, Google mobility trends for places of work is also up since December. These stats bode well for consumer spending and business investment, two key components to economic growth and corporate profits.
The speed at which federal, state, and local governments shuttered the economy gave rise to an unprecedented shift away from services spending and into goods spending. Now, the debate is centered on how fast this compositional shift will revert to more normal ratios.
Purchasing a New Washing Machine Happens Only So Many Times
At the height of the pandemic shutdowns, consumers spent discretionary funds on bikes, boats, beds, or books. Few spent on cruises and casinos. Even if people wanted those services, governmental authorities closed those doors.
An unintended consequence of this massive shift in demand from services to goods created immense pressure on suppliers to get products to the market in a timely fashion. The toilet paper and N95 mask shortages of 2020 illustrate fundamental laws of economics. If prices and supply are fixed in the short run and consumer demand spikes, the market will experience shortages. In a freely functioning economy, the simple way to fix a shortage is for suppliers to raise prices and post COVID-19, these fundamental laws still hold true. Much of the lingering inflationary pressures come from these supply and demand imbalances. However, demand for durable goods will likely normalize soon. Most people do not buy a new washing machine on a regular or even semi-regular basis. Outside of the ratio of goods to services spending, suppliers are also dealing with demand that may be sustained longer than anticipated. For example, a new study by Global Industry Analysts report that the N95 mask market will reach $11.8 billion in a few years.1 For our forecast, we expect consumer goods spending to contribute to growth in 2022 but not at the same rate as 2021 (Figure 1).
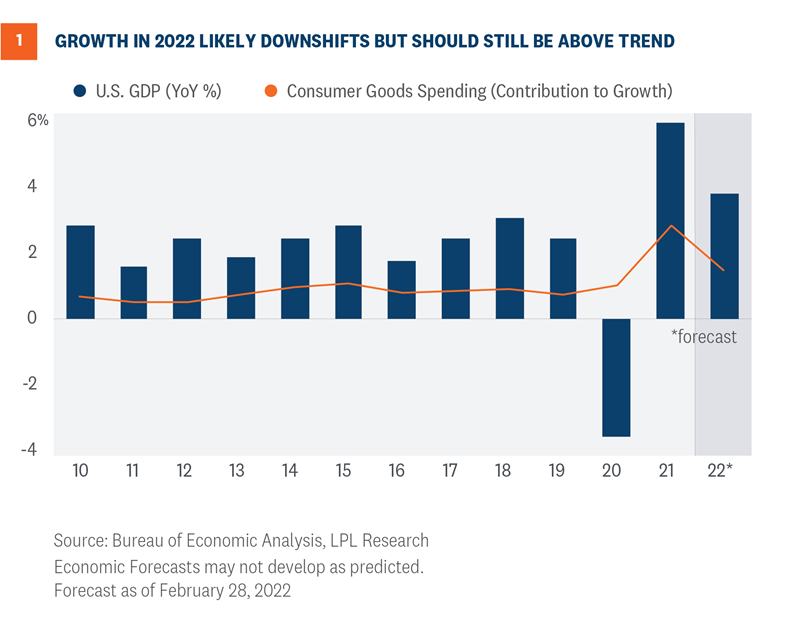
In previous years, consumer goods spending contributed less than 1% to overall GDP, and if domestic consumers normalize spending habits this year, we will have downside risk to our 2022 growth estimate. Consumers pulled forward demand, so goods consumption added an outsized amount to headline growth.
A Rebound in Services Spending Could Support Growth in Q3 and Q4
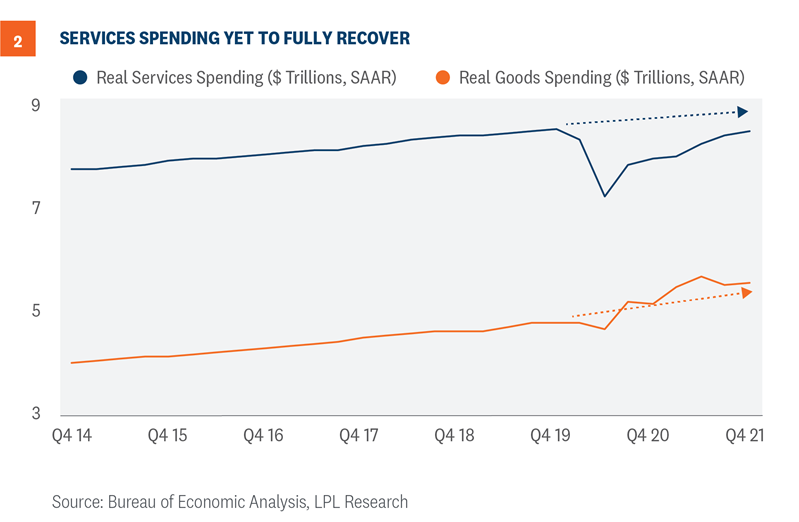
The base case for the forecast rests on a recovery in services spending as the year progresses. Real spending on goods will normalize as consumers pulled forward demand in recent quarters and as consumers had stimulus funds to spend while sheltered at home. Still, services spending is below trend (Figure 2).
Risks to the Forecast
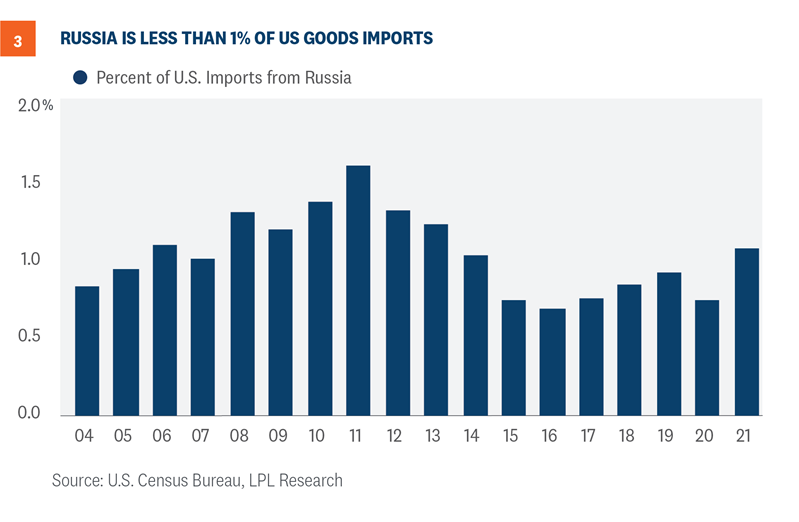
Our baseline forecast expects the Federal Reserve to move at a measured pace and not likely “shock and awe” the markets with unexpected large rate hikes. We also expect that as demand and supply imbalances normalize, consumers will expect easing pricing pressures. Ripple effects from the Russian invasion of Ukraine will be mostly in Europe and will be minimal in the U.S. Russia only accounts for roughly 1% of U.S. goods imports (Figure 3). Our forecast does have risks to the downside as commodity prices have spiked and we do not know how OPEC+ and other systemically important entities will respond.
1 https://finance.yahoo.com/news/global-n95-masks-market-reach-162500512.html?guccounter=1&guce_referrer=aHR0cHM6Ly93d3cuZ29vZ2xlLmNvbS8&guce_referrer_sig=AQAAALc_1e4fyvnrereNnwWfvM3sCJzrFsFJDBtV4k3Ub9IrJBGtdjhRhb0_qf4hVVtz89WKpZfxZqpPeuwwbyHgK7eAewj7bENcPgkOT3n5NJU6psgyVuMj7ra2ER0GjwTNU0uP3BTfsLINfy2j7oz2mDgNdu3LuFQ9PGjT218l5qVs
______________________________________________________________________________________________
IMPORTANT DISCLOSURES
This material is for general information only and is not intended to provide specific advice or recommendations for any individual. There is no assurance that the views or strategies discussed are suitable for all investors or will yield positive outcomes. Investing involves risks including possible loss of principal. Any economic forecasts set forth may not develop as predicted and are subject to change.
References to markets, asset classes, and sectors are generally regarding the corresponding market index. Indexes are unmanaged statistical composites and cannot be invested into directly. Index performance is not indicative of the performance of any investment and does not reflect fees, expenses, or sales charges. All performance referenced is historical and is no guarantee of future results.
Any company names noted herein are for educational purposes only and not an indication of trading intent or a solicitation of their products or services. LPL Financial doesn’t provide research on individual equities.
All information is believed to be from reliable sources; however, LPL Financial makes no representation as to its completeness or accuracy.
U.S. Treasuries may be considered “safe haven” investments but do carry some degree of risk including interest rate, credit, and market risk. Bonds are subject to market and interest rate risk if sold prior to maturity. Bond values will decline as interest rates rise and bonds are subject to availability and change in price.
The Standard & Poor’s 500 Index (S&P500) is a capitalization-weighted index of 500 stocks designed to measure performance of the broad domestic economy through changes in the aggregate market value of 500 stocks representing all major industries.
The PE ratio (price-to-earnings ratio) is a measure of the price paid for a share relative to the annual net income or profit earned by the firm per share. It is a financial ratio used for valuation: a higher PE ratio means that investors are paying more for each unit of net income, so the stock is more expensive compared to one with lower PE ratio.
Earnings per share (EPS) is the portion of a company’s profit allocated to each outstanding share of common stock. EPS serves as an indicator of a company’s profitability. Earnings per share is generally considered to be the single most important variable in determining a share’s price. It is also a major component used to calculate the price-to-earnings valuation ratio.
All index data from FactSet.
This research material has been prepared by LPL Financial LLC.
Securities and advisory services offered through LPL Financial (LPL), a registered investment advisor and broker-dealer (member FINRA/SIPC). Insurance products are offered through LPL or its licensed affiliates. To the extent you are receiving investment advice from a separately registered independent investment advisor that is not an LPL affiliate, please note LPL makes no representation with respect to such entity.
| Not Insured by FDIC/NCUA or Any Other Government Agency | Not Bank/Credit Union Guaranteed | Not Bank/Credit Union Deposits or Obligations | May Lose Value |
RES-1074500-0322 | For Public Use | Tracking # 1-05252116 (Exp. 3/23)