

The market pundits remain intensely focused on the question of whether the U.S. economy is in or about to enter recession, so we thought a piece on what a recession might mean for the stock market would be of interest. While Friday’s strong jobs report provides more evidence that the U.S. economy is not currently in recession, odds are still perhaps a coin flip or better that one may come in the next year. Here we update changing recession prospects and what that might mean for stocks.
Where did all the jobs go?
Payrolls surged by 528,000 in July and the unemployment rate fell to 3.5%. Moreover, net revisions to the previous two months added another 28,000 jobs to the original estimates. Clearly, these gains further cement the claim that the U.S. is currently not in recession. Job gains were broad-based and especially prominent in sectors such as education, health care, and government. Firms ramped up production and increased manufacturing payrolls by roughly 30,000 in July. New jobs in manufacturing are likely due to improved supply chains, and this sector should continue to add jobs as remaining supply bottlenecks improve.
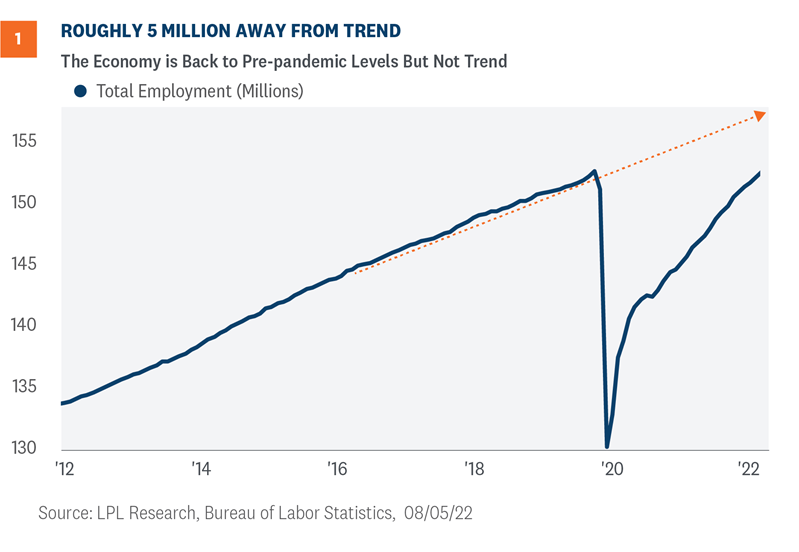
Total employment has returned to pre-pandemic levels in February 2020 but not back to pre-pandemic trends [Figure 1]. We could argue over which is more important, but both tell a specific story about the health of the consumer and the broad economy. Trends give a wider context for the labor market. A lurking risk is those not in the labor force will experience skill erosion and the economy will have downside risk to productivity growth in the coming quarters. Although we are not likely in recession now, risks are rising for next year. The economy needs a stable and productive workforce to handle tighter financial conditions and growing uncertainty about 2023. Despite the risk, the economy could still have a soft landing as the Federal Reserve (Fed) tightens monetary policy to combat historic inflation pressures.
Participation rates are below pre-pandemic levels
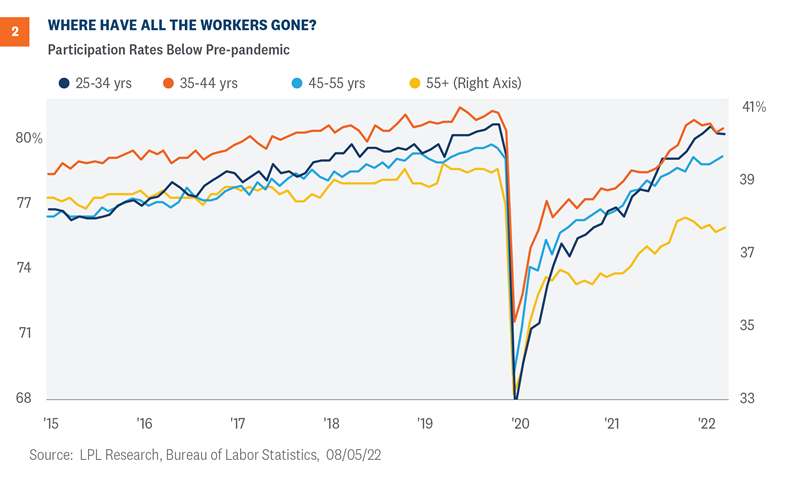
The participation rate dipped slightly to 62.1% as the labor force shrunk in July by 63,000 and the unemployment rate fell to 3.5%, a decline of 0.1% percentage point. A nagging concern as the economy pivots from reopening to retooling is the low participation rate. For all age groups, participation rates have not recovered from the pandemic, which is one of the sour notes in an otherwise sweet report. Overall, the July labor force participation rate was 1.3 percentage points below February 2020, and the largest gaps were for those of high school and college age and those 55 years old and up [Figure 2].
The decline in unemployment and the participation rate will frustrate central bankers since a tighter labor market adds inflation risk to the economy. So far, wages have not kept up with inflation. Average hourly earnings rose 0.5% in July after rising 0.4% the previous month. As of July, average hourly earnings were 5.2% higher than a year ago.
Markets are having trouble digesting the implications of the strong labor market in July. The big headline gain in jobs was a surprise and could convince people like San Francisco Fed President Mary Daly that the economy needs another 75 basis point hike at the Fed’s next meeting. All eyes are now on inflation.
Stocks and Recessions
Market strategists and pundits make the relationship between recessions and the stock market seem binary, but each economic contraction is different and has different effects on earnings. That said, it is still instructive to look at what stocks have historically done during recessions to get an idea of potential stock market scenarios.
First, keep in mind that stocks tend to look forward by four to six months and can provide warnings of changing economic conditions. For example, the start of the bear market decline earlier this year told us weaker growth and lower earnings were coming—and stocks certainly got that right. Bigger losses through June sent a stronger signal—that the odds of recession were probably over 50%.
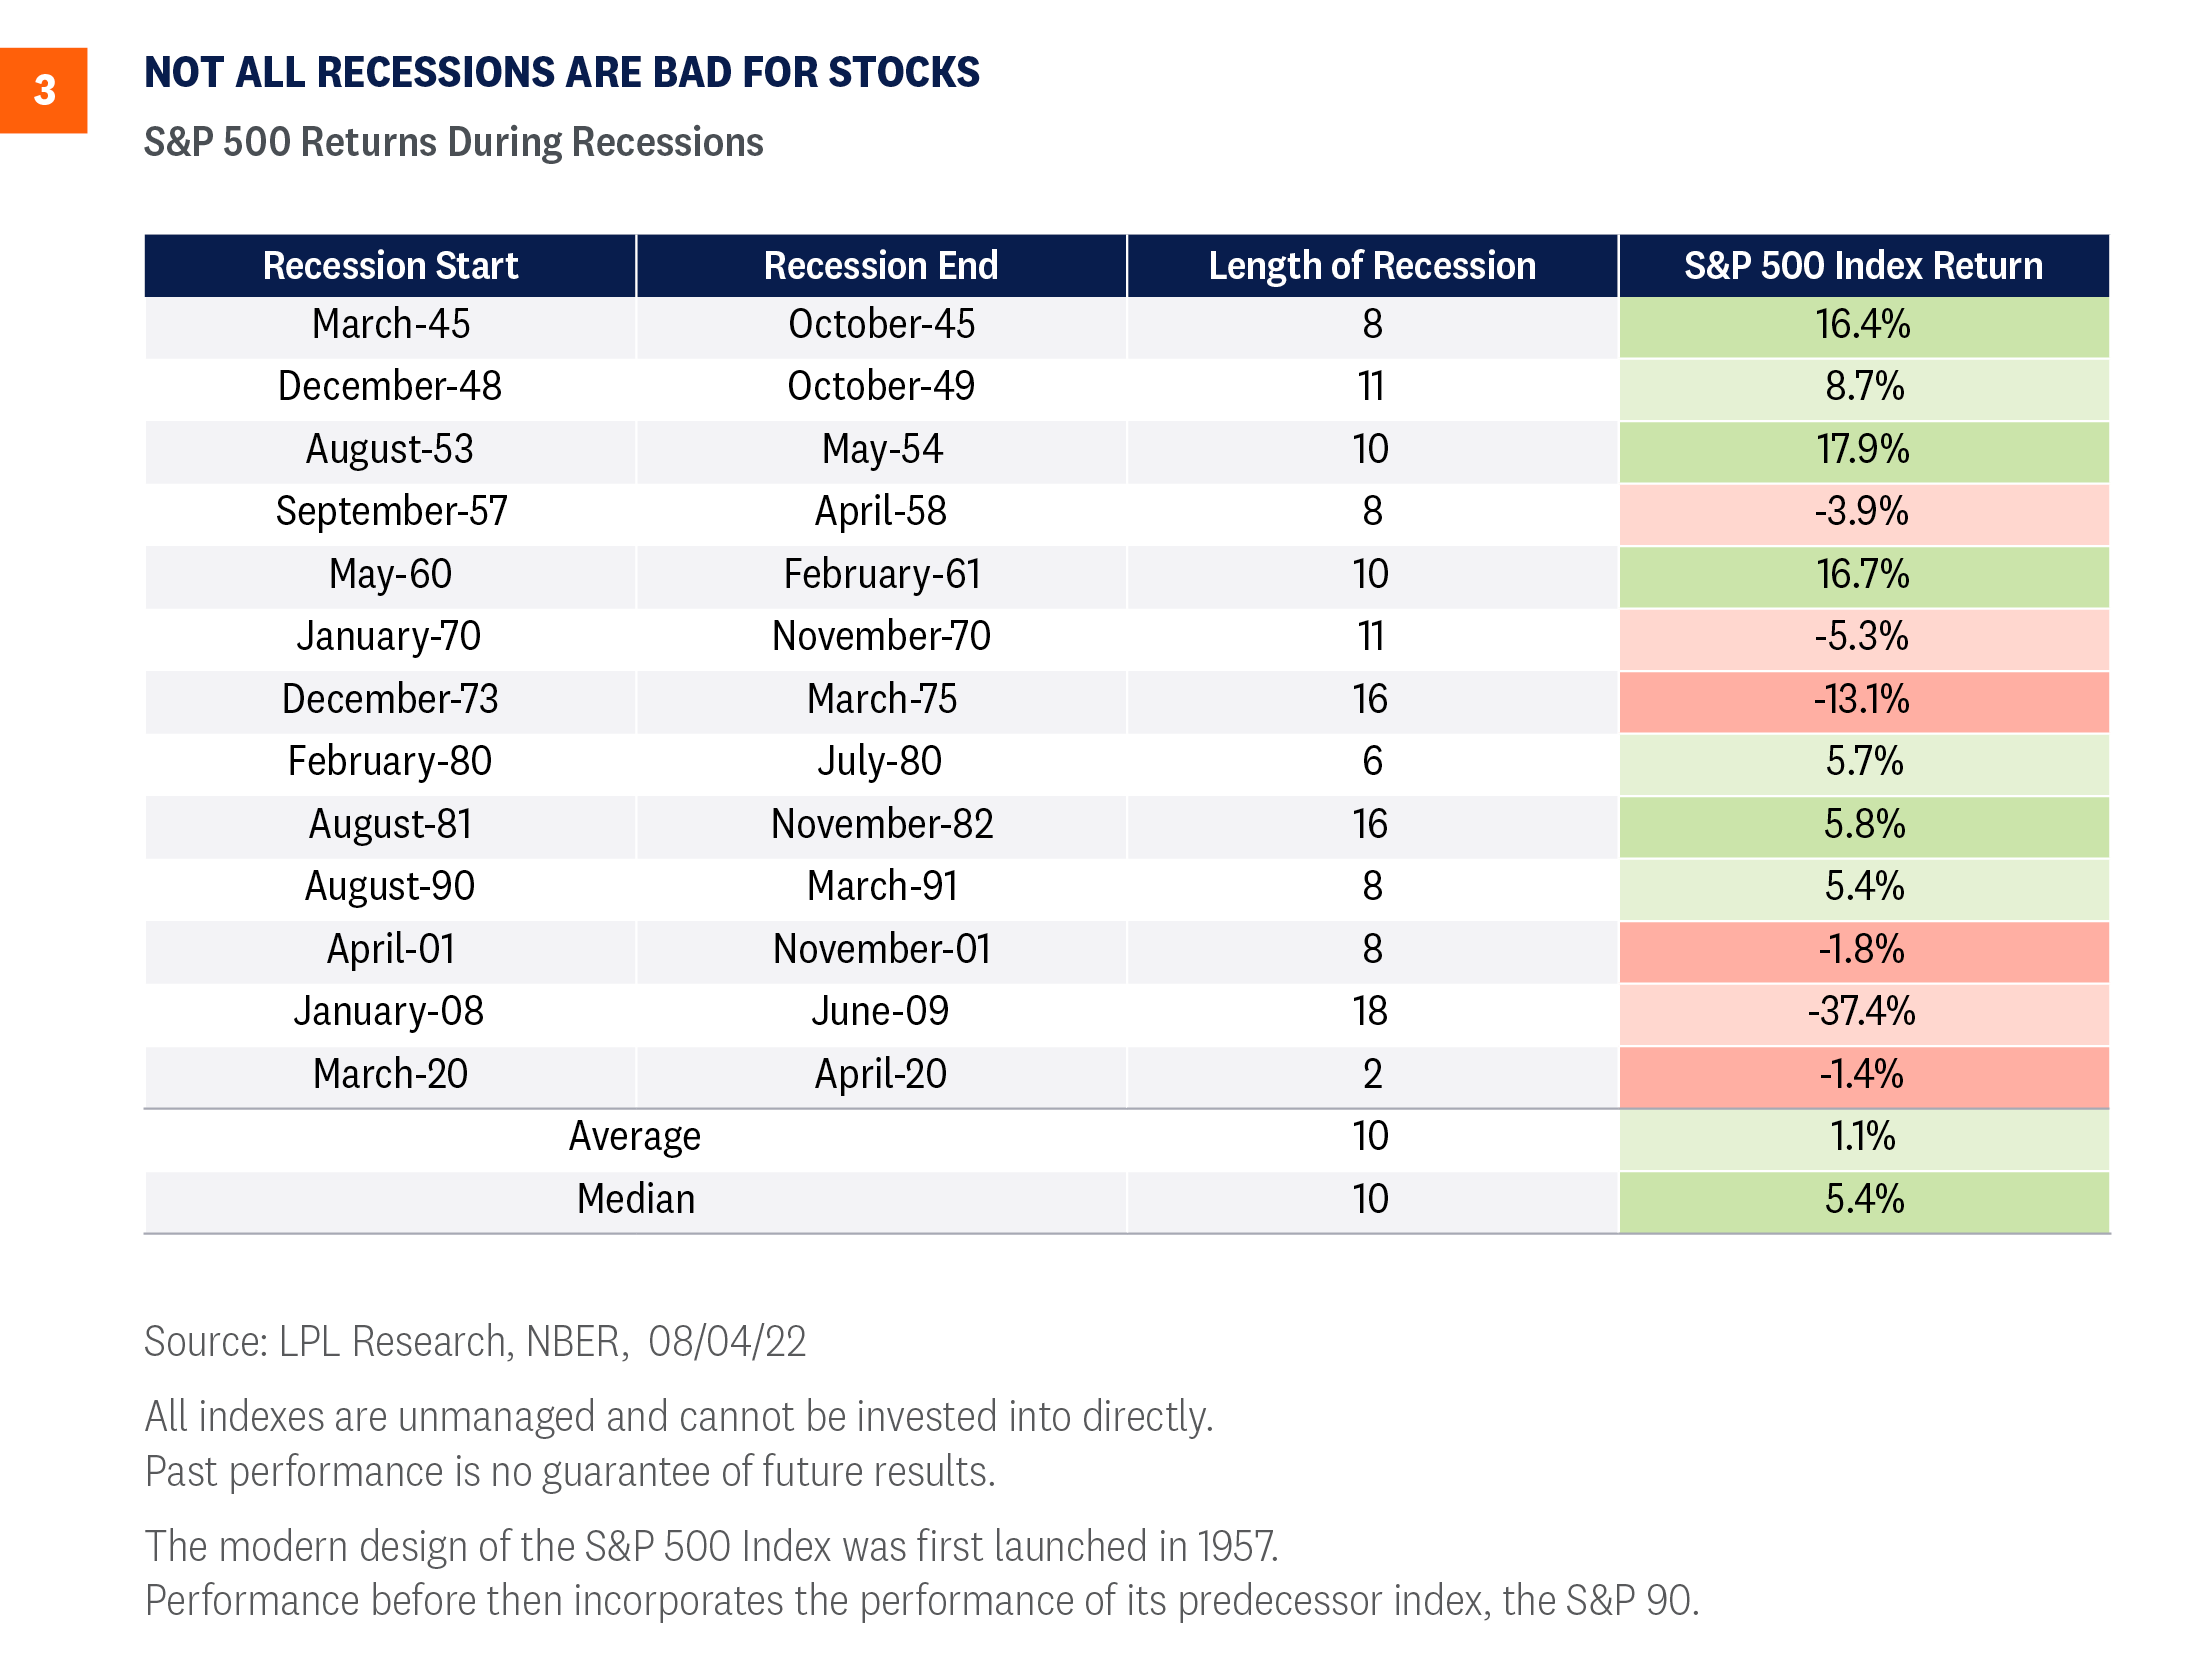
The entirety of a recession—particularly a mild one—hasn’t historically been all that bad for stocks from start to finish. As shown in Figure 3, the median S&P 500 performance during recessions has actually been positive at 5.4%. The average of 1.1% is dragged down by 2008-2009 when the index tumbled 37%.
How can this be? It’s because stocks anticipate both the start and end of recessions several months ahead of time. In particular, the trough of a recession tends to be followed by powerful rallies before the recession officially ends. By the time the recession is deemed over, the stock market’s recovery is typically well underway.
Looking at a different angle, the path of bear markets is greatly influenced by the recession question. As shown in Figure 4, the S&P 500 Index has averaged a 30% peak-to-trough decline during all bear markets since 1956 (We count declines of 19-20% for the purposes of this analysis.). When these bear markets are parsed by recession, we can see the severity of the declines tends to vary widely.
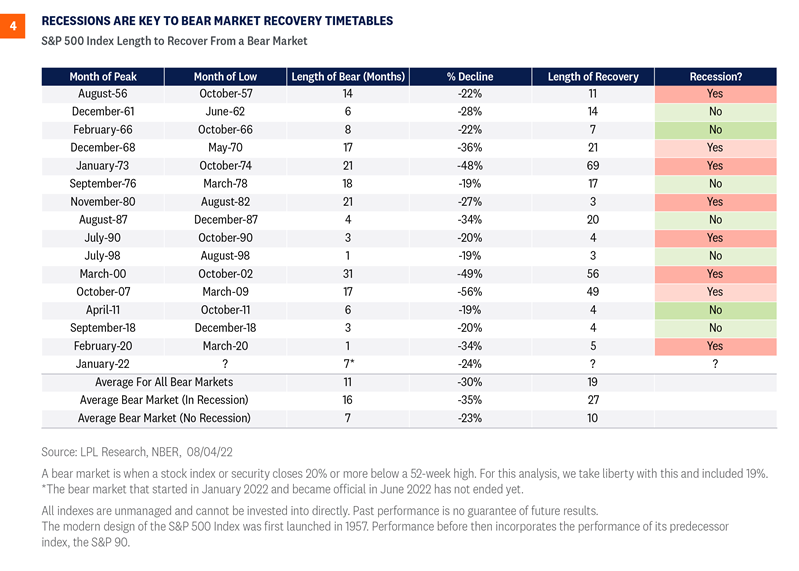
Without a recession, bear markets tend to trough in seven months. In that scenario, the market’s trough came on June 16, and this bear market is almost surely already over. But we won’t know for sure until stocks rally more than 20% to mark the start of the next bull.
Bear markets without recessions typically fall between 20% and 28%, or 23% on average. So far during the current bear market, the maximum peak-to-trough decline was 23.5%. If the U.S. economy does go into recession, we would not expect it to start for another six to 12 months, giving stocks some time to advance as inflation pressures presumably cool. We won’t predict a soft landing, but there is a plausible scenario where a mild recession comes in 2023, the S&P 500 does not retest its June 2022 lows, and stocks are nicely higher in a year. We’ll see.
Conclusion
We maintain our preference for equities over fixed income and cash in our recommended tactical asset allocation. However, after a 13% bounce in the S&P 500 off the June 16 low, there is no doubt the risk-reward has become less favorable. Stock valuations are higher but bond yields are still low enough to support valuations with the 10-year Treasury yield well under 3% despite the big jobs number. Although Friday’s very strong jobs report reduces recession risk for 2022, it also likely slows the inflation cooling process and increases the chances that the Fed gets more aggressive.
Markets can take some comfort in the strong job market, healthy consumer balance sheets, and generally solid earnings results for the second quarter. Inflation is eroding consumer purchasing power, but signs of cooling continue to emanate from the commodity markets, fixed income markets, and consumer and business surveys. Earnings estimates will likely have to come down, but probably not as much as the market anticipates, and S&P 500 revenue has risen double-digits for the seventh straight quarter.
And while most students of technical analysis see near-term downside based on the lack of capitulation or panic-selling in recent weeks, we do believe the latest rally has increased the chances that the June lows hold, and rallies off of mid-term election year lows have been extremely strong historically.
Our year-end 2022 fair value S&P 500 target of 4,300-4,400 is 5% above the August 5 closing price at the midpoint. Bottom line, we still expect a growing economy, expanding earnings, and still-low and stable interest rates to fuel higher stock prices despite another likely full percentage point of Fed rate hikes this year, a sluggish economic growth outlook, and heightened geopolitical tensions.
Click here to download a PDF of this report.
IMPORTANT DISCLOSURES
This material is for general information only and is not intended to provide specific advice or recommendations for any individual. There is no assurance that the views or strategies discussed are suitable for all investors or will yield positive outcomes. Investing involves risks including possible loss of principal. Any economic forecasts set forth may not develop as predicted and are subject to change.
References to markets, asset classes, and sectors are generally regarding the corresponding market index. Indexes are unmanaged statistical composites and cannot be invested into directly. Index performance is not indicative of the performance of any investment and does not reflect fees, expenses, or sales charges. All performance referenced is historical and is no guarantee of future results.
Any company names noted herein are for educational purposes only and not an indication of trading intent or a solicitation of their products or services. LPL Financial doesn’t provide research on individual equities.
All information is believed to be from reliable sources; however, LPL Financial makes no representation as to its completeness or accuracy.
U.S. Treasuries may be considered “safe haven” investments but do carry some degree of risk including interest rate, credit, and market risk. Bonds are subject to market and interest rate risk if sold prior to maturity. Bond values will decline as interest rates rise and bonds are subject to availability and change in price.
The Standard & Poor’s 500 Index (S&P500) is a capitalization-weighted index of 500 stocks designed to measure performance of the broad domestic economy through changes in the aggregate market value of 500 stocks representing all major industries.
The PE ratio (price-to-earnings ratio) is a measure of the price paid for a share relative to the annual net income or profit earned by the firm per share. It is a financial ratio used for valuation: a higher PE ratio means that investors are paying more for each unit of net income, so the stock is more expensive compared to one with lower PE ratio.
Earnings per share (EPS) is the portion of a company’s profit allocated to each outstanding share of common stock. EPS serves as an indicator of a company’s profitability. Earnings per share is generally considered to be the single most important variable in determining a share’s price. It is also a major component used to calculate the price-to-earnings valuation ratio.
All index data from FactSet.
This research material has been prepared by LPL Financial LLC.
Securities and advisory services offered through LPL Financial (LPL), a registered inv estment advisor and broker -dealer (member FINRA/SIPC). Insurance products are offered through LPL or its licensed affiliates. To the extent you are receiving investment a dvice from a separately registered independent investment advisor that is not an LPL affiliate, please note LPL makes no representation with respect to such entity.
| Not Insured by FDIC/NCUA or Any Other Government Agency | Not Bank/Credit Union Guaranteed | Not Bank/Credit Union Deposits or Obligations | May Lose Value |
RES-1232651-0822 | For Public Use | Tracking # 1-05313086 (Exp. 08/23)