

Artificial intelligence (AI) makes daily headlines, and investors are questioning if businesses’ AI-related investment can continue at this pace. The money spent on data centers, software, and other AI-related investments reveal the structural shifts occurring in the economy. The latest on Commercial & Industrial (C&I) Loans gives us insights into the sustainability of this trend. If an economy wants to encourage innovation, entrepreneurship, and scientific development, businesses need a stable macro environment with price stability, strong property rights, and dynamic capital markets that can fund great ideas.
AI Investment Surge Signals Structural Shift in Growth
AI-related business investment is rapidly becoming a cornerstone of U.S. economic growth, marking a structural shift in how expansion is financed and sustained. In the first half of 2025, investment in information-processing equipment and software — largely driven by AI infrastructure — is a small yet mighty slice of the economy, yet contributed a majority to economic growth during that period. This surge is being led by hyperscalers, like Microsoft, Amazon, Meta, and Alphabet, which are collectively projected to spend hundreds of billions on AI-related capital expenditures this year. The boom includes massive data center construction, hardware purchases, and early-stage investments in supporting infrastructure like power grids. While the full economic impact is still unfolding, AI investment has already outpaced traditional growth drivers like consumer spending, suggesting a fundamental restructuring of the economy’s growth model. We will address more of this phenomenon in our upcoming 2026 Outlook. Nonetheless, AI-related capital spending is expected to play an even larger role, and not just in tech, but across sectors adapting to automation, data-driven decision-making, and productivity enhancement. The reordering of international trade this year intensifies the pressure on domestic firms to improve productivity and lower input costs. AI is part of that process.
Intellectual Property Products Added to Economic Growth
Business spending on intellectual property products, which includes software as well as any research and development spending, boosted economic growth by the largest amount in the history of the data going back to 1947. The “Intellectual Property Added Historic Level to Growth in Q2” chart illustrates the 0.8 percentage point contribution to gross domestic product (GDP) and if we include computer and peripheral equipment, the numbers are more staggering. Together, these AI-related categories contributed 1.5 percentage points to the 3.8% annualized growth in the second quarter. Business investment in intellectual property could continue to have an outsized role in the economy in the years to come. For more company-specific commentary on the so-called AI arms race, visit “From Micro to Macro: A Busy Week of Market-Moving Data”.
Intellectual Property Added Historic Level to Growth in Q2
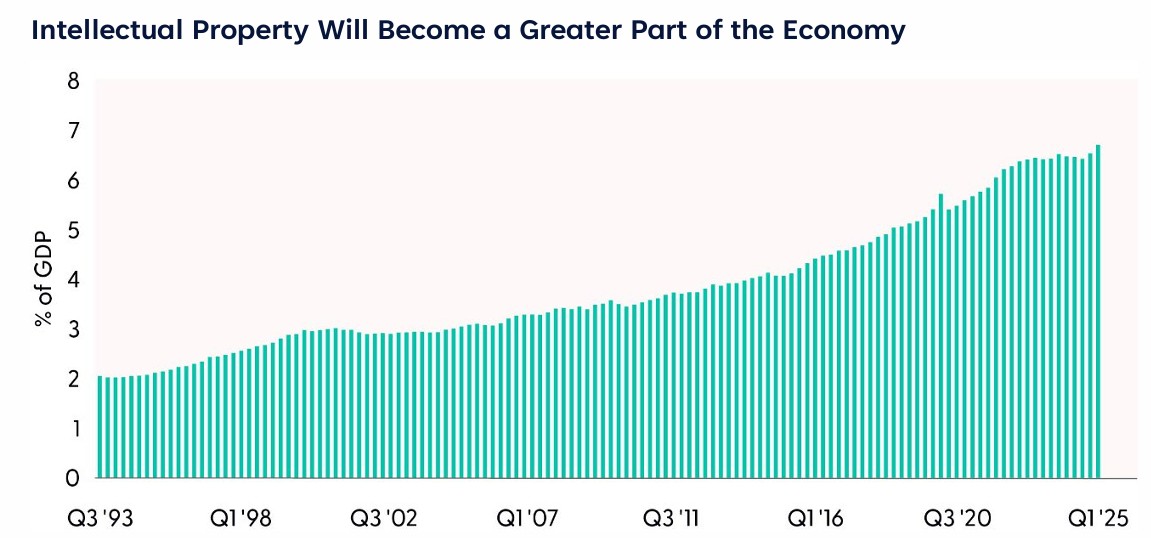
Source: LPL Research, Bureau of Economic Analysis 11/10/25
Disclosures: Past performance is no guarantee of future results.
Construction Cash Converging on Data Centers
A popular expression in the capital market is “money flows where it’s treated best.” In this context, we could say “capital is flowing toward AI because that’s where expected productivity gains are the strongest.” That’s not as pithy, but it explains what is happening now. Businesses are increasingly channeling investment into AI infrastructure, tools, and talent, not just to stay competitive but to redefine productivity itself. This isn’t a passing trend; it’s a structural shift in the economy, where dollars are chasing data, algorithms, and automation. As firms seek higher returns and long-term efficiency, AI-related spending is emerging as a key driver of growth, innovation, and transformation across industries.
Data Center Construction Bucks the Trend
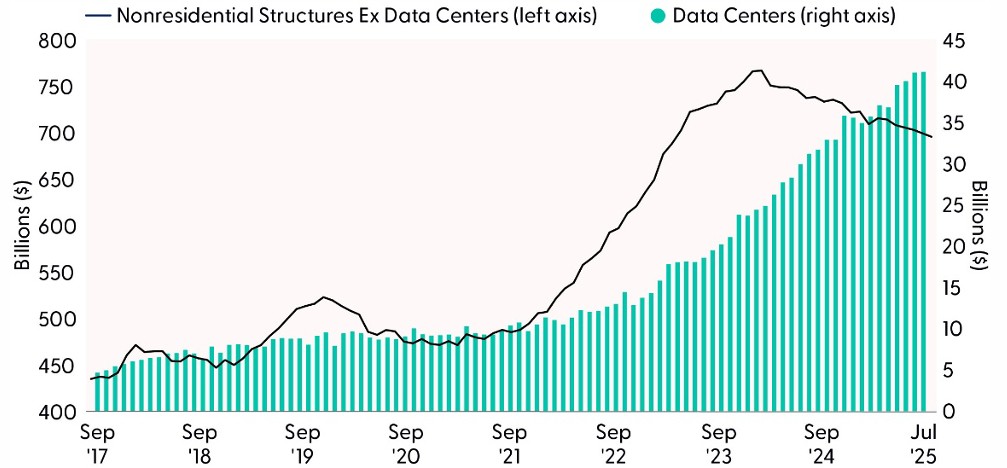
Source: LPL Research, Census Bureau 11/10/25
Capital spending on nonresidential structures, which include a wide range of buildings from offices to hospitals, has declined for the past two years. The bright spot is in data centers. The Census Bureau first broke out data center construction as a distinct line item in its Monthly Construction Spending report in July 2025, released on September 2, 2025. This addition reflects the growing economic significance of data center investment, particularly as AI related infrastructure spending surges. The new categorization allows for more precise tracking of capital flows into digital infrastructure, which has become a key driver of nonresidential private construction.
Call to Action and What Will the Fed Do Next?
We think there is room for more expansion in AI-related capital spending, despite some calling this overextended. A more near-term concern is the lingering impact of this historic lapse in appropriations. Since the government shutdown has lasted long enough to prevent the Bureau of Labor Statistics (BLS) from collecting price data, the agency needs a backup plan. Instead of leaving a gap in the data, the BLS could estimate missing months by using data from surrounding months, a method called interpolation. This approach is already being used when events like bad weather disrupt data collection. However, applying it to an entire price index — rather than just a few items — is largely uncharted territory. According to recent reports, the BLS will likely work closely with other agencies to ensure any estimates are statistically sound, but it’s a scenario they’ve rarely had to navigate.
Despite the lack of visibility as of now, the weakening job market could bring the Federal Open Market Committee (FOMC) to cut rates in December, giving in to what the markets would like to see and potentially appeasing tech heavy investors. That said, the LPL Research Strategic and Tactical Asset Allocation Committee (STAAC) remains tactically neutral on the information technology sector, where many of these AI names are concentrated, and overweight U.S. large cap growth equities. Given tech’s concentration in large U.S. indexes (~8.4% of the S&P 500, and ~13.7% of the Russell 1000 Growth Index), our current positioning provides exposure to the AI theme while continuing to be wary that a market increasingly reliant on a handful of tech giants could amplify volatility and concentration risk going forward.
Asset Allocation Insights
The STAAC maintains its tactical neutral stance on equities. Investors may be well served by bracing for occasional bouts of volatility given how much optimism is reflected in stock valuations, but fundamentals remain broadly supportive. STAAC’s regional preferences across the U.S., developed international, and emerging markets (EM) are aligned with benchmarks. The Committee still favors growth over value, large caps over small caps, and the communication services and financials sectors.
Within fixed income, the STAAC holds a neutral weight in core bonds, with a slight preference for mortgage-backed securities (MBS) over investment-grade corporates. The Committee believes the risk-reward for core bond sectors (U.S. Treasury, agency MBS, investment-grade corporates) is more attractive than plus sectors. The Committee does not believe adding duration (interest rate sensitivity) at current levels is attractive and remains neutral relative to benchmarks.
Important Disclosures
This material is for general information only and is not intended to provide specific advice or recommendations for any individual. There is no assurance that the views or strategies discussed are suitable for all investors or will yield positive outcomes. Investing involves risks including possible loss of principal. Any economic forecasts set forth may not develop as predicted and are subject to change.
References to markets, asset classes, and sectors are generally regarding the corresponding market index. Indexes are unmanaged statistical composites and cannot be invested into directly. Index performance is not indicative of the performance of any investment and do not reflect fees, expenses, or sales charges. All performance referenced is historical and is no guarantee of future results.
Any company names noted herein are for educational purposes only and not an indication of trading intent or a solicitation of their products or services. LPL Financial doesn’t provide research on individual equities.
All information is believed to be from reliable sources; however, LPL Financial makes no representation as to its completeness or accuracy.
All investing involves risk, including possible loss of principal.
US Treasuries may be considered “safe haven” investments but do carry some degree of risk including interest rate, credit, and market risk. Bonds are subject to market and interest rate risk if sold prior to maturity. Bond values will decline as interest rates rise and bonds are subject to availability and change in price.
The Standard & Poor’s 500 Index (S&P500) is a capitalization-weighted index of 500 stocks designed to measure performance of the broad domestic economy through changes in the aggregate market value of 500 stocks representing all major industries.
The PE ratio (price-to-earnings ratio) is a measure of the price paid for a share relative to the annual net income or profit earned by the firm per share. It is a financial ratio used for valuation: a higher PE ratio means that investors are paying more for each unit of net income, so the stock is more expensive compared to one with lower PE ratio.
Earnings per share (EPS) is the portion of a company’s profit allocated to each outstanding share of common stock. EPS serves as an indicator of a company’s profitability. Earnings per share is generally considered to be the single most important variable in determining a share’s price. It is also a major component used to calculate the price-to-earnings valuation ratio.
All index data from FactSet or Bloomberg.
This research material has been prepared by LPL Financial LLC.
Not Insured by FDIC/NCUA or Any Other Government Agency | Not Bank/Credit Union Guaranteed | Not Bank/Credit Union Deposits or Obligations | May Lose Value
For public use.
Member FINRA/SIPC.
RES-0006316-1025 Tracking #823053 | #823054 (Exp. 11/26)